Monitor a third-party dependency with two signals: the provider's official incident feed and your own customer-path check. The feed helps explain scope. A green provider indicator cannot prove that your token, region, DNS route or API request succeeds.

A customer request may depend on a CDN, email API, payment gateway and cloud storage. When checkout fails, the provider's status page is useful context but does not test your account or exact path. We queried the public status APIs of Cloudflare, Twilio and GitHub for a dated snapshot. Those samples are not a reliability ranking.
How the signals fit together
Customer → your application → provider API → confirmed outcome
             │                   │
             ├─ your path check ──┘
             └─ provider incident feed
Decision: path failure + provider report + local logs
Choose an operation a customer cares about: sending a sign-in email, creating a payment session, or reading an object. Test that operation with safe data. Separately subscribe to the provider's official incident feed or query its API. When an alert fires, compare timestamps, components and regions. Agreement points toward an external issue; disagreement calls for checking your credentials, limits, routing or an incident the provider has not yet published.
Do not suppress your own alert because a provider page is green. Status pages reflect published information and can lag the first failed requests. Their aggregate indicator can also miss a problem limited to one account, region or product feature. Your customer-path test remains the primary symptom.
Map your dependencies
Write down the five most valuable customer actions and list external services on each path. For every connection, record the owner, component, region, likely degraded behavior, fallback and official status URL. This map gives the on-call engineer a useful starting point when a broad report such as “the site is slow” arrives.
| Dependency | Your check | Provider feed | Response |
|---|---|---|---|
| CDN | Fetch a critical asset from the target region | CDN component and region | Inspect origin and route |
| Email API | Rate-limited test delivery | API and queue status | Queue a retry |
| Payments | Sandbox session and confirmed order | Gateway and webhooks | Keep order pending until confirmed |
| Storage | Read a safe test object | Storage region | Enter a degraded mode |
For SMS, measure the delay from a Twilio request to arrival on a dedicated test number; an accepted API request is not proof of delivery. Limit frequency and cost, and exclude that number from customer campaigns. For OAuth, test the authorized code exchange in a dedicated test application, not only the provider's login page. An expired client secret or incorrect redirect URI affects your integration alone and may never appear on a provider status page.
Read an official status API
Several providers expose a Statuspage-compatible JSON endpoint at /api/v2/status.json. It returns an aggregate indicator and description. Our local script received HTTP 200 from the three public APIs. At the sample time, Cloudflare and Twilio reported minor; GitHub reported none. These values can change at any time and do not describe your specific customer request.
curl -fsS https://www.githubstatus.com/api/v2/status.json
# HTTP 200; status.indicator: none (sample on 14 Nov 2026)
curl -fsS https://www.cloudflarestatus.com/api/v2/status.json
# HTTP 200; status.indicator: minor (same sample)
Check the feed's own availability. If it fails, mark provider status unknown rather than healthy. If the provider offers RSS, email or webhook notifications, choose a channel that retains incident events. Record the incident ID and update time so repeated polls do not create repeated alerts.
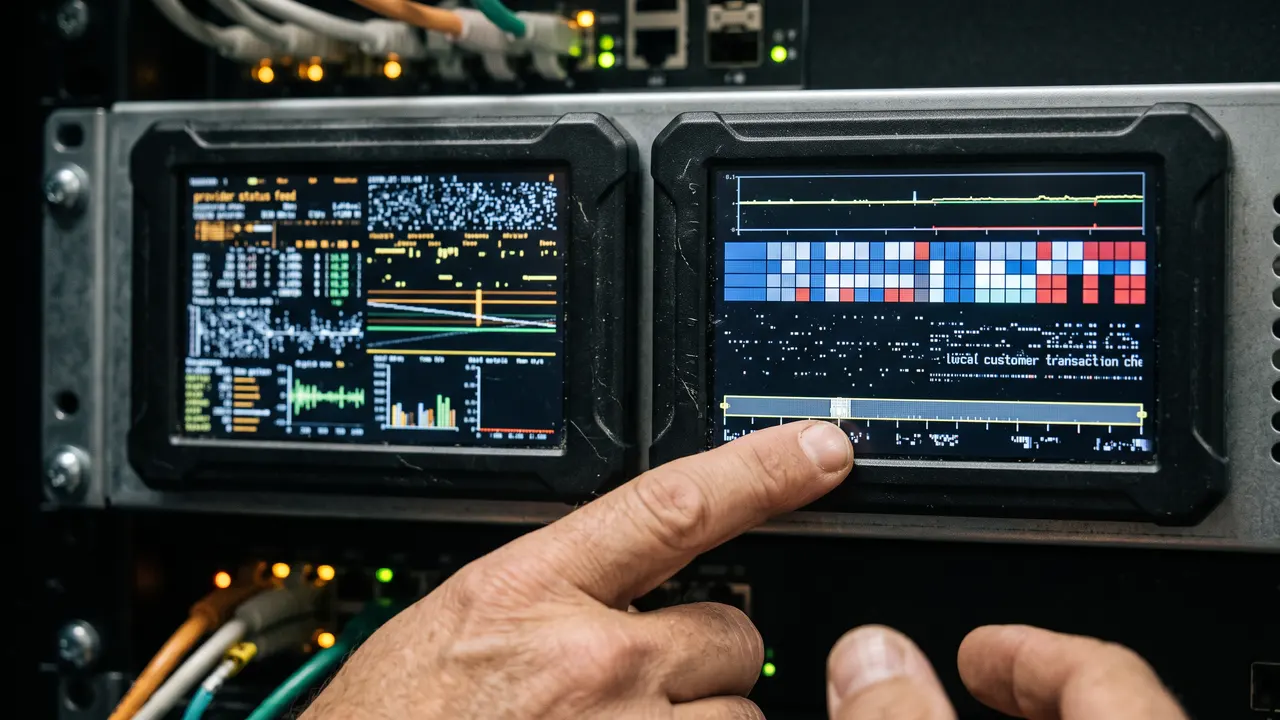
Provider status beside your transaction
Use an enterno.io monitor for your public endpoint or an enterno.io synthetic check for a key action. Alert on the customer path and attach provider news as context. When signals disagree, inspect API responses, external availability and TLS. A private probe with heartbeat can cover internal endpoints.
An alert should say which action failed, where it was measured and what the provider reports. Add a runbook link. Keep your own monitor active during a provider incident: it will show when your product actually recovers. The provider's status may return to green before your backlog is drained.
Trade-offs
| Method | Detects | Blind spot |
|---|---|---|
| Provider page alone | Published widespread incident | Your account or exact request |
| Your check alone | Failure on your path | External scope and cause |
| Both signals | Symptom plus context | Needs alert grouping and ownership |
Keep the synthetic operation safe and cheap. Do not email customers every minute or make real charges. A sandbox, test address and rate limit provide useful evidence without side effects. For payments, assert the server-side callback and order state.
Example: the provider works but your order remains pending
Suppose a browser monitor creates a sandbox order and reaches the payment page. The provider page is green, yet the order remains pending two minutes later. Find the test operation ID and verify that a payment session was created. Then look for a webhook with the same ID. If none arrived, inspect the endpoint configuration, TLS, delivery queue and provider events. If it did arrive, inspect signature validation and the database write. The provider's aggregate status offers little help when only your webhook path is broken.
Now imagine your sandbox operations fail in two regions while the provider reports a payment API incident. That report speeds classification, but keep your own checks running. After the provider API recovers, your application may still be draining queued events. Close the incident when your own full order check succeeds, not when the provider changes its banner.
SMS has the same distinction. An API may accept a message with HTTP 202 while delivery to the test number fails because of a carrier route or account restriction. Check final delivery events when available and use a dedicated number. For OAuth, the outcome is a token issued and validated for a test application, not simply a loaded authorization page. Keep tokens out of screenshots and shared logs.
Design safe checks with bounded side effects
Give every synthetic request a dedicated test object and rate limit. For a CDN, request an immutable static asset and verify a known marker. For email, use a mailbox that does not forward to customers. For SMS, use a test number or provider sandbox. For payments, use only test mode and confirm the server-side order state. If a provider offers no safe way to execute the full operation, check the closest safe stage and state the limitation plainly.
Calculate the test budget before enabling a schedule. A one-minute SMS check creates 1,440 messages per day from one location. Across three regions that becomes 4,320. It may consume quota or money while a less frequent check meets the detection objective. Apply the same calculation to free API quotas and provider rate limits. A synthetic monitor should not cause the incident it is meant to detect.
Protect test data. Payment identifiers, phone numbers and OAuth tokens do not belong in public logs or reports. An alert usually needs only a safe check ID, error type, UTC time and a link to the restricted internal trace. When a provider feed supplies incident details, link the component and update rather than duplicating a long message in every alert.
Group alerts and verify recovery
Map dependencies to customer actions. One CDN outage can trigger dozens of similar failures; group them by component and time while preserving affected actions. The reverse also occurs: one region or account tier can break because of local configuration. A single undifferentiated alert would hide the impact boundary.
Record your first failed check and the provider's first incident update. The gap can reveal publication delay, but one event does not establish a general performance statistic. To confirm recovery, require a full successful customer-path run after the fix. For asynchronous operations, wait for the queue to drain. The provider's resolved message is context, not proof that your product works.
Review the map each quarter. External APIs change domains, component names and notification methods. An old status URL can redirect or fail while your parser silently treats an empty result as green. Test that unknown states remain unknown and record the feed's last update time. Missing data then becomes visible to the responder instead of becoming a false healthy signal.
Our snapshot contains exactly three providers and three HTTP 200 responses: two indicators were minor and one was none. That describes one API request to each provider, not an outage rate. Reliability analysis would require long observation, a consistent sample interval and a definition of customer impact. This example contains none of those measurements.
How we made this
On 14 November 2026 a local script queried public JSON APIs for Cloudflare, Twilio and GitHub and saved response codes, indicators and sample time. This is three observations at one instant, with no claim about actual customer routes. The signal model and recommendations were checked against the providers' official APIs and Google SRE monitoring guidance.
FAQ
Does a green status page prove the API works?
No. It reports published aggregate status. Test your request with your region and test account.
What if the status API is down?
Mark provider status unknown and keep your own checks running. A status API error alone does not establish that the main service is unavailable.
How do I prevent duplicate alerts?
Use the customer operation as the primary alert and attach provider events as context. Group messages by time, component and incident ID.