To diagnose slow INP, record the actual click in Chrome Performance and match it to a long frame and the Long Animation Frame (LoAF) script attribution. In our local Chrome 154 fixture, the frame lasted 192–193 ms and its slowClick handler about 190 ms. That is a diagnostic example, not a field INP value.
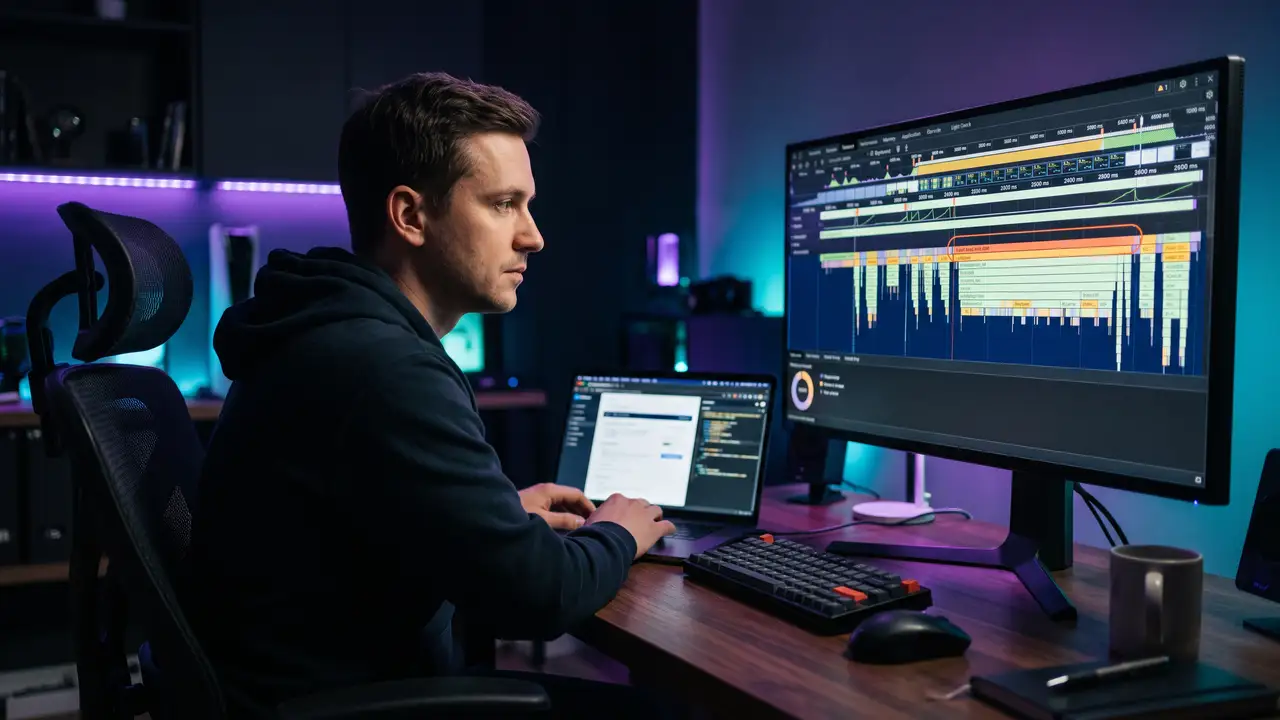
Interaction to Next Paint (INP) captures the delay before an interaction produces a visual response. After a click, the browser may wait for a busy main thread, run event handlers, calculate style and layout, then draw the next frame. Long Tasks expose tasks over 50 ms, but one task does not always explain a whole late frame. The Long Animation Frames API records frames over 50 ms and, in supported browsers, attributes some script work.
What you need
- A page and an action that reliably feels slow.
- Chrome DevTools Performance and a mobile viewport.
- Source code or source maps for resolving the handler.
- Field INP to prioritize a URL and device, where available.
Our local click is not a user sample. Start with the real URL and device if field INP is weak. The CrUX and Lighthouse comparison explains why one lab run can differ from field metrics.
Step 1. Record the slow action
Open Performance, start recording, perform one problematic click and stop. Avoid a long trace full of unrelated interactions. Inspect the Interactions and Main tracks, then separate input delay, handler execution and the delay until the next paint. If a third-party script appears, inspect its initiator and calls rather than blaming a file name alone.
Repeat the action in a consistent state. A cold load, warm cache and open widget can produce different traces. Make a separate mobile CPU recording: desktop hardware often hides the stall reported by visitors on slower devices.
Step 2. Match tasks to the frame
Find a long task on Main. If JavaScript dominates, use Bottom-up or Call tree to locate the work. Then inspect the frame containing the interaction. LoAF can span multiple tasks and rendering phases. If most time is style or layout, optimizing one handler may barely help. If the delay is before the handler, examine competing work already occupying the main thread.
| Observation | Likely phase | Next check |
|---|---|---|
| Long task before click processing | Input delay | Other Main-thread scripts |
| Long event handler | Processing duration | Call stack and synchronous code |
| Short handler, long frame | Possible rendering delay | Style, layout and paint |
| No LoAF entry | Unsupported API or missing data | Performance trace and Long Tasks |
A script attributed to a frame is not necessarily its only cause. Some work has limited attribution. Always inspect the full timeline and user action. LoAF browser support is limited, so keep the ordinary Performance trace in your workflow.
Step 3. Find the handler in scripts
On a browser with LoAF support, observe long-animation-frame entries. The snippet links a frame to available scripts information. If you add field instrumentation, avoid sending complete user URLs or query parameters to analytics. Our local fixture produced the following:
new PerformanceObserver(list => {
  for (const frame of list.getEntries()) {
    console.table(frame.scripts.map(script => ({
      name: script.sourceFunctionName,
      duration: script.duration,
      invoker: script.invoker
    })));
  }
}).observe({ type: 'long-animation-frame', buffered: true });
// fixture: frame 192–193 ms; slowClick handler ≈190 ms
Check PerformanceObserver.supportedEntryTypes before using the observer. Function names may be empty or changed by minification; source maps and a DevTools trace can recover the code path. blockingDuration is a frame property, not a complete INP measurement. Match the frame timestamp to the interaction and visible change.
Step 4. Fix the bottleneck
When a handler performs heavy synchronous calculations, split the work and schedule noncritical work after visible feedback. A Web Worker can handle computation that does not need the DOM. If code repeatedly reads geometry and writes styles, group reads and writes to avoid forced layout. If the click builds a huge DOM tree, reduce the rerender and inspect CSS. Preserve the action's meaning: moving every operation into an unbounded queue is not a user-visible fix.
Record the same click after the change with the same device setup. Look for a shorter handler or smaller rendering delay in the phase you fixed. Then follow field INP for the same URL and device. The enterno.io speed tool can capture a lab snapshot, while field data confirm visitor impact.
What our local run showed
We built a button with a handler that occupied roughly 190 ms synchronously. Three clicks on a local page in Chrome 154 produced frames of 193, 192 and 192 ms. Script attribution identified slowClick; blockingDuration was about 142 ms. This shows how to find a known handler. It does not measure enterno.io field INP or imply that every 190 ms handler produces the same INP on another page.
If the trace does not explain the delay
| Symptom | Possible cause | Action |
|---|---|---|
| Fast locally | Different device or state | Repeat mobile scenario with widget open |
| Long frame without scripts | Limited attribution | Inspect Main, style/layout and paint |
| Large input delay | Main thread busy before click | Find preceding tasks |
| Weak INP after fix | Another action or rolling field window | Match URL, action and period |
How we made this
We ran a local HTTP fixture and Playwright scenario in Chrome 154 in November 2026. The code in lab/server.py and lab/measure.cjs, plus raw lab/data.json, are stored with the draft. Three repetitions demonstrate a reproducible case, not a statistical conclusion about users. We checked LoAF semantics and browser support against Chrome, MDN and web.dev documentation.
Keep the reproduction comparable
Write down the UI state before testing: whether search or chat is open, cookie consent status, number of visible cards and data already held in memory. Two identical clicks can otherwise follow different code paths. If the delay appears only after a long reading session, leave the page open for a similar period and repeat the action. Compare call stacks as well as duration.
Inspect first-party and third-party JavaScript separately. A library on the stack is not automatically at fault; application code may call it in an expensive way. Before removing a dependency, reproduce the path without the suspected handler in a local branch and verify that the user action still works.
If a click loads a new module, compare cold-cache and warm-cache scenarios. Long script execution after download can overlap with network waiting, but the remedies differ. The request timing guide helps inspect network phases, while third-party dependency monitoring helps detect an external failure. If the delay also moves the page, inspect CLS: the long frame and shift may share a DOM cause.
Verify the fix by phase. If processing becomes short but the frame remains long, inspect layout and paint next. If the long frame disappears but the action still feels delayed, inspect work before the event. Keep the before and after traces with the exact interaction so the regression can be reproduced later.
Limit PerformanceObserver collection to the durations and page version you need. Full stacks and URLs can contain unnecessary data; the example above is primarily for local diagnosis.
FAQ
Does LoAF replace Long Tasks?
No. Long Tasks show main-thread occupancy; LoAF shows long frames and available script attribution. Both help within a trace.
Why can INP exceed a 190 ms handler?
INP includes time waiting before processing and time until the next paint. Function duration is only one part.
What if the browser does not support LoAF?
Use the Performance recording, Interactions track and Main-task analysis. Detect API support at runtime.